Widget specific customization - Area timeline
Area timeline is generic widget which can be configured to show.
-
Daily energy consumption or
-
Daily faults
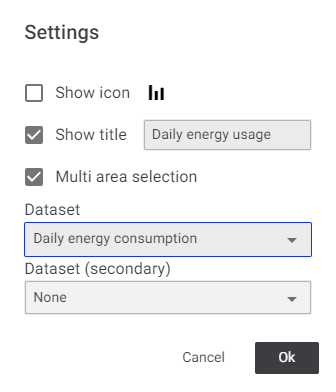
The configurable elements of the widgets are:
-
Dataset: Selectable options are:
-
Daily energy consumption: If selected, the widget shows area energy consumption per day for the last 7 days by default. The user can choose a timeline between the last 7, 14, 21 and 28 days.
-
Daily fault: If selected, the widget shows faults per day for the last 7 days by default. The user can choose a timeline between the last 7, 14, 21 and 28 days. The default value is None.
-
-
Multi area selection: If enabled, the graph shows areas information (energy consumption or faults) on single bar stacked on each other with different color. The user can select and/or deselect each area.
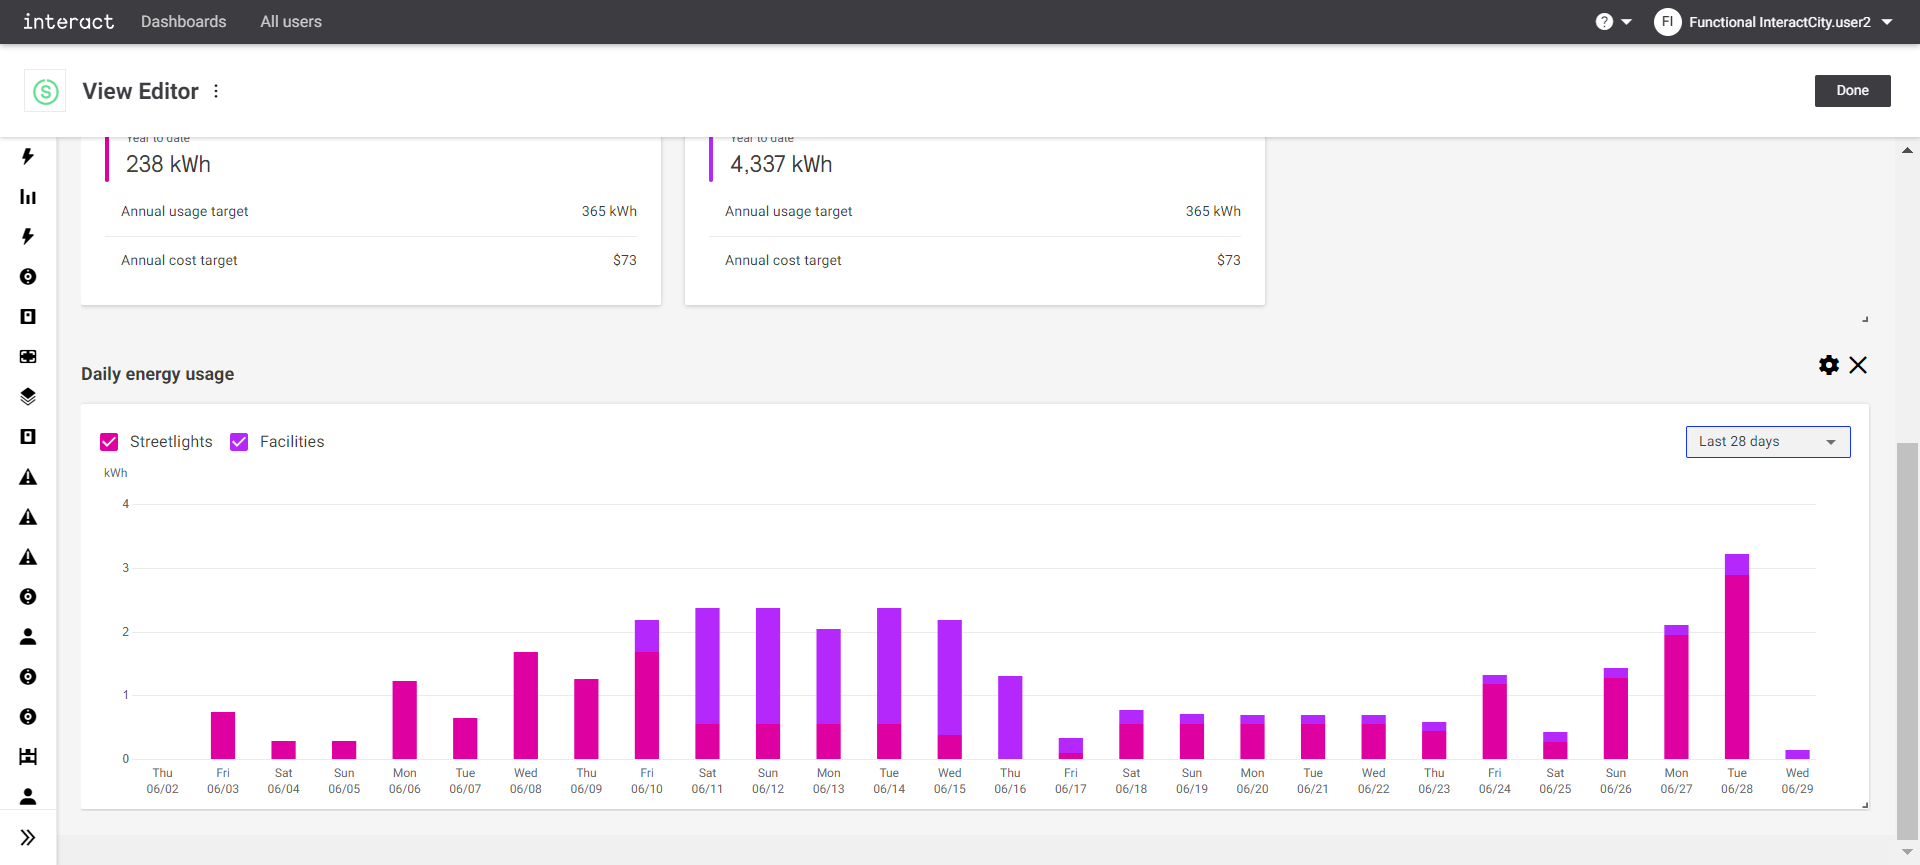 View editor
If disabled, the graph shows single area information at a time. An area is selectable from the drop-down list.
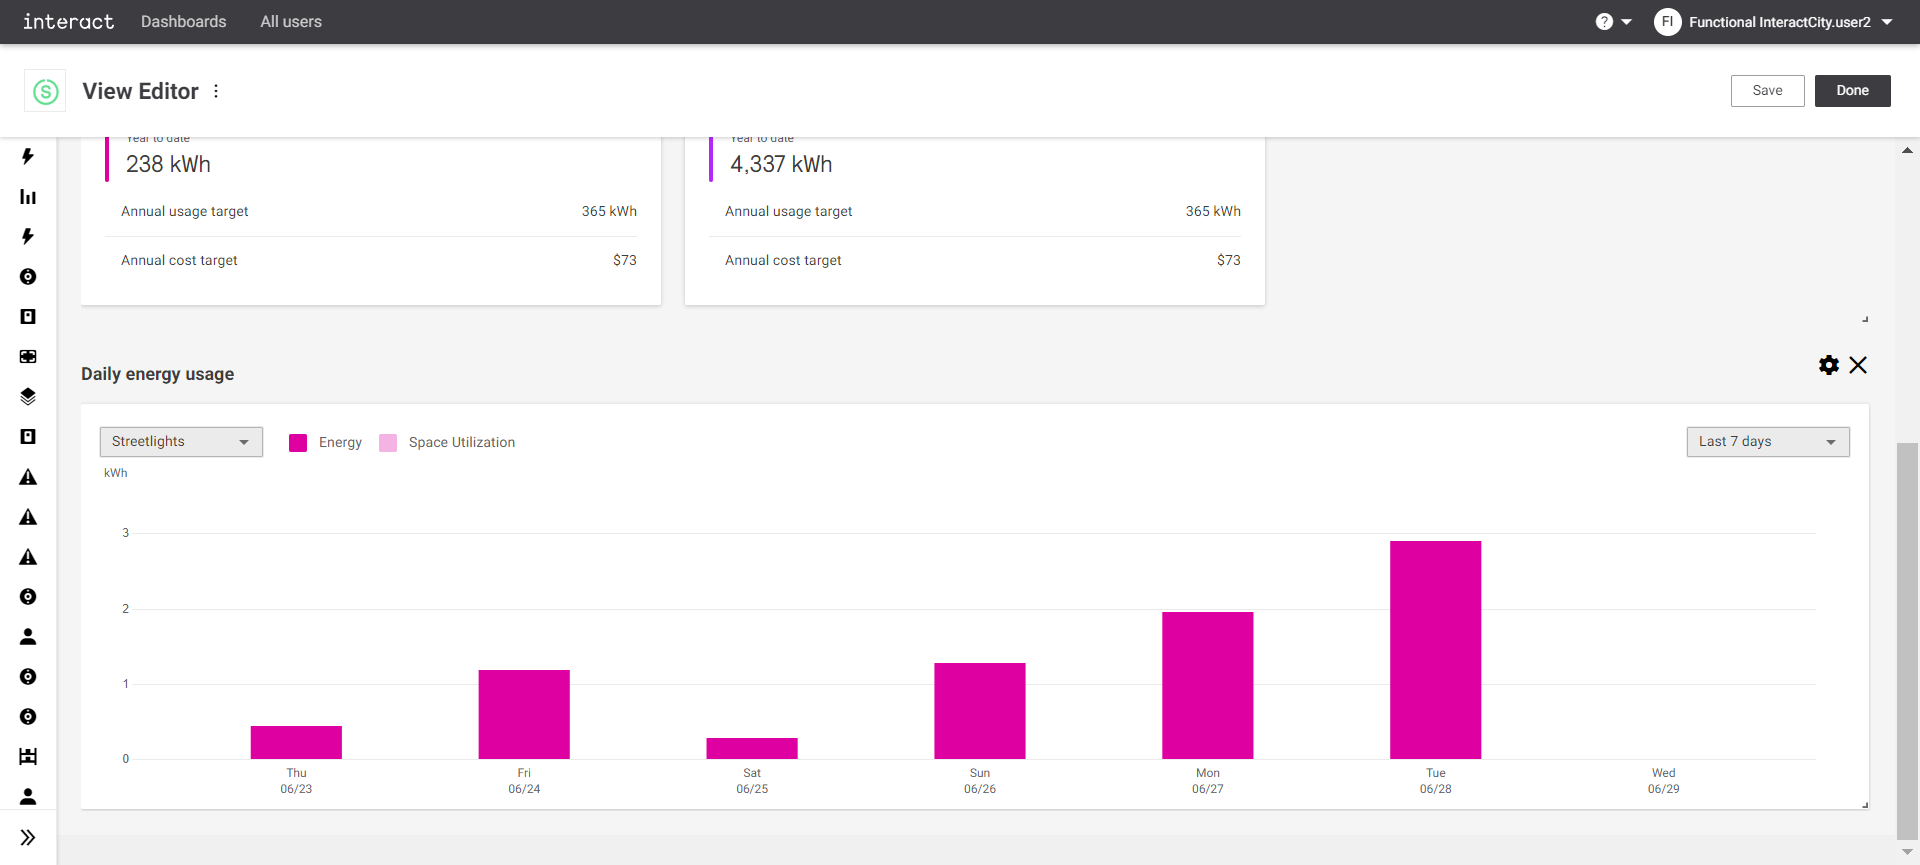 View editor daily energy streetlights